A calendar invites seek to create an experience of time through touch
Polyester
Fiber fill
screen printing
Inspired by the puffer jackets I saw everywhere during winter, I imagined a calendar that doesn’t just mark days but embodies the feeling of each day. Each puff represents a day from November to December in Providence, filled according to actual daily temperature data collected from weather records. Instead of printing numbers, I translated the temperatures into different filling densities: the colder the day, the denser the filling; the warmer the day, the lighter it feels. This piece is not about simply providing data. Numbers are clear, but they’re also detached and distant. I wanted to offer something else: a way to feel the temperature, to imagine the day, rather than just reading a figure.
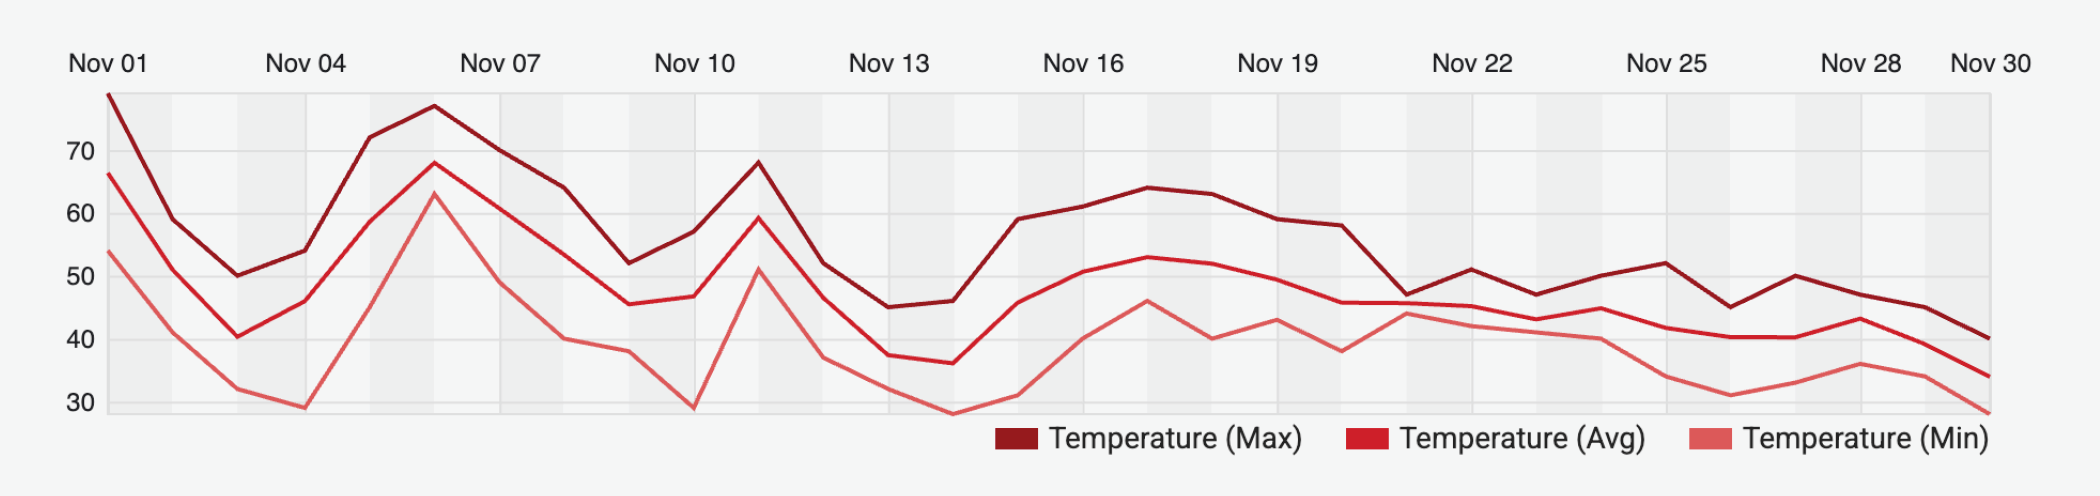
Temperature Data of Providence
Such numerical representations are common in our daily weather checks: precise, informative, yet inherently impersonal. They convey information in a unidirectional manner, leaving little room for personal interpretation or emotional connection.
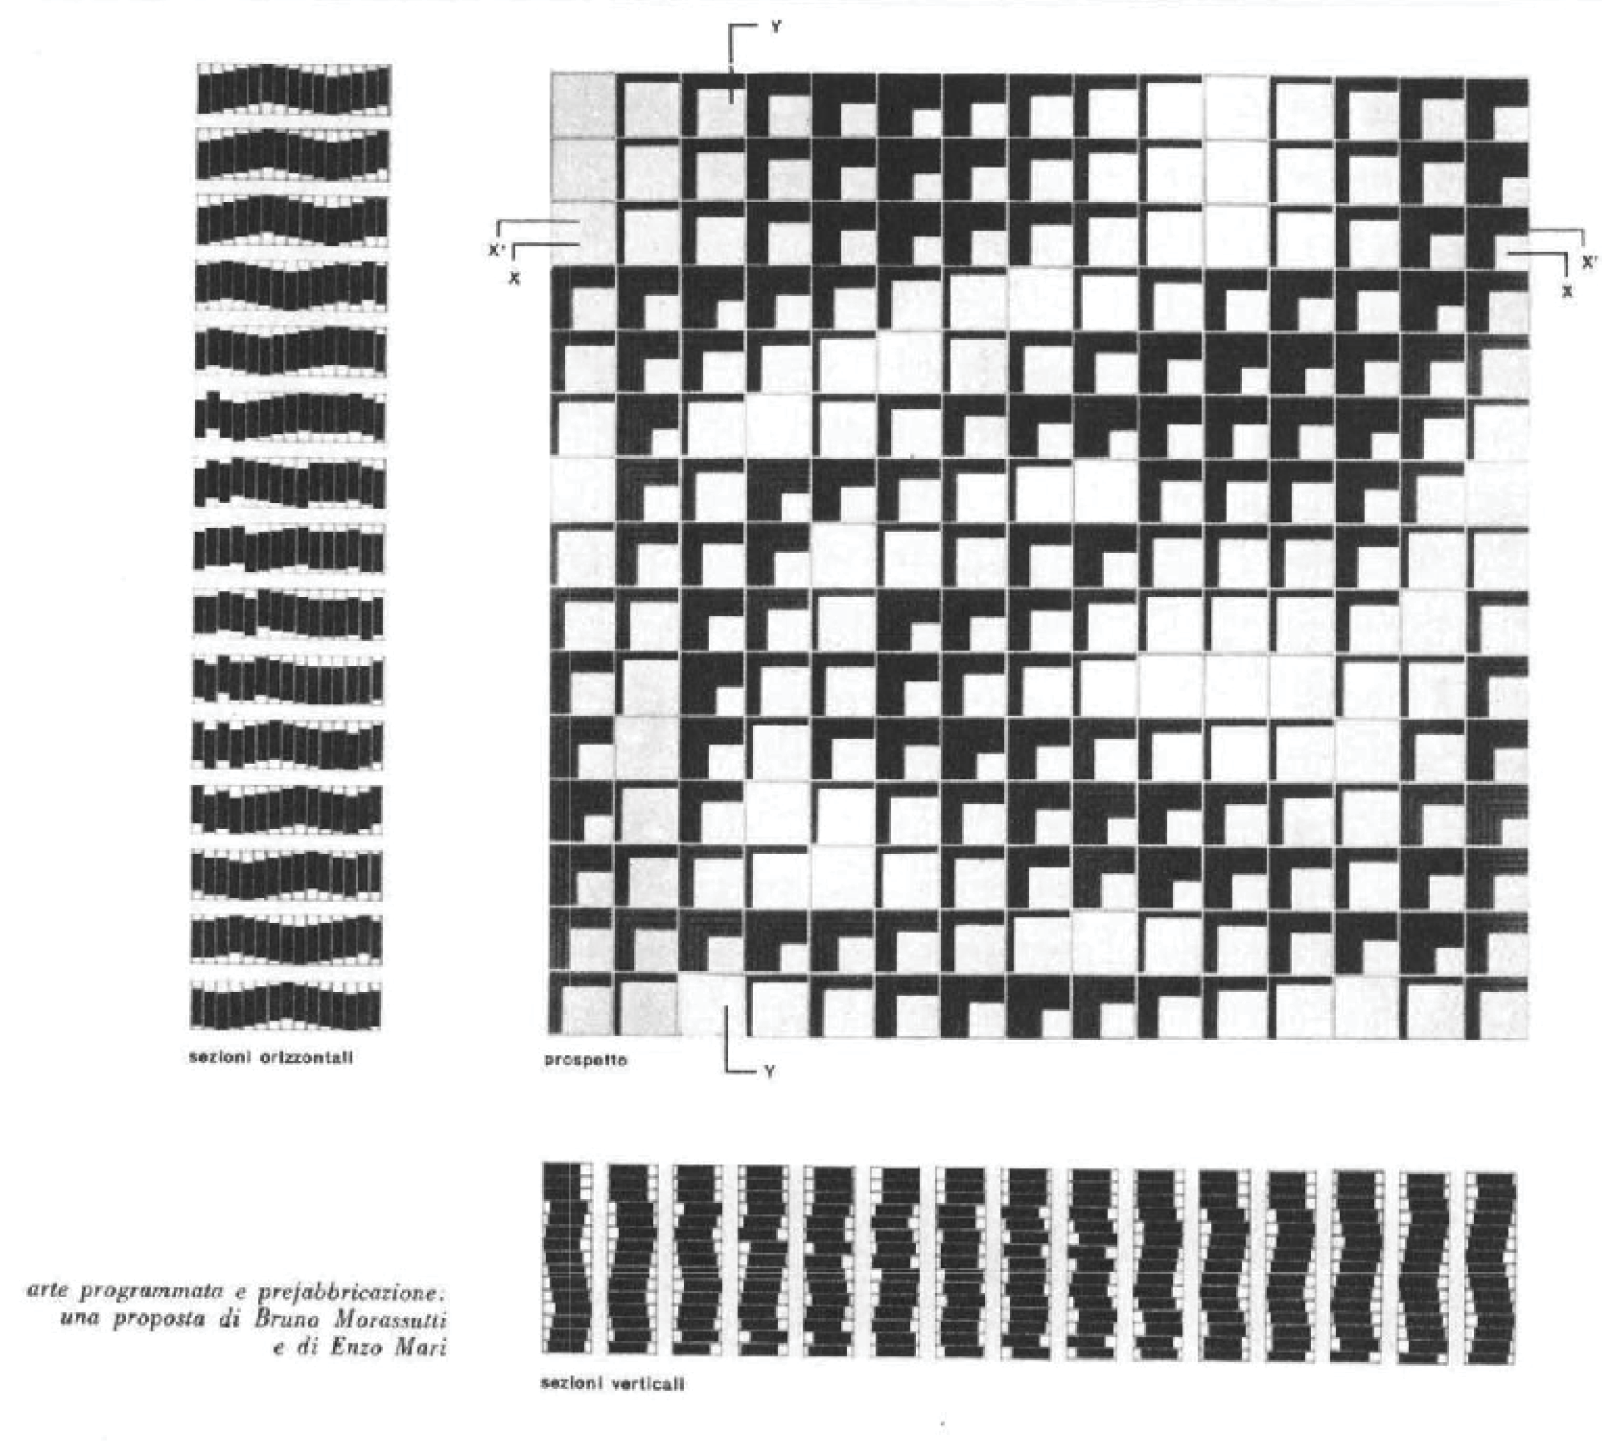
Overlaying the tactile surface is a bold, flowing typographic system inspired by Enzo Mari’s 1963 study of light and shadow. The typography moves across the puffs like a shadow or breeze, evoking the gentle movement of fabric or a flag. It doesn’t label or instruct; it provides a visual rhythm, complementing the physical texture. Together, the typography and the material create a dialogue between seeing and feeling, reading and touching, inviting a slower, contemplative engagement.
Enzo Mari and Bruno Morassutti
From the article Arte programmata e prefabbricazione
1965
Enzo Mari and Bruno Morassutti explored the integration of programmed art into architectural prefabrication. Their work emphasized modular systems and the dynamic interplay between structure and perception. Inspired by Mari’s exploration of systematic design and visual rhythm, I aimed to infuse a sense of movement into the static fabric. I want to create a visual experience where the fabric appears to ripple, evoking the sensation of wind-blown material, thereby bridging the gap between the tangible and the perceptual.
The making of this piece was as much an exploration as the final object. I first screen-printed the calendar layout onto fabric, laying out each day as a small square. Then, I used a sewing machine to stitch each day’s square into its own small pocket, creating the spaces that would later be filled. Using the average daily temperature data for each date, I carefully determined how much filling should go into each puff: more stuffing for colder days, less for warmer ones. Then, one by one, I filled each puff by hand, sealed it, and watched the calendar take shape as the days grew heavier or lighter beneath my hands. This process was slow, repetitive, almost meditative—each stitch and each handful of stuffing becoming a physical way of mapping time. It felt like I wasn’t just making an object; it was an act of translating numbers into material, transforming data into touch.
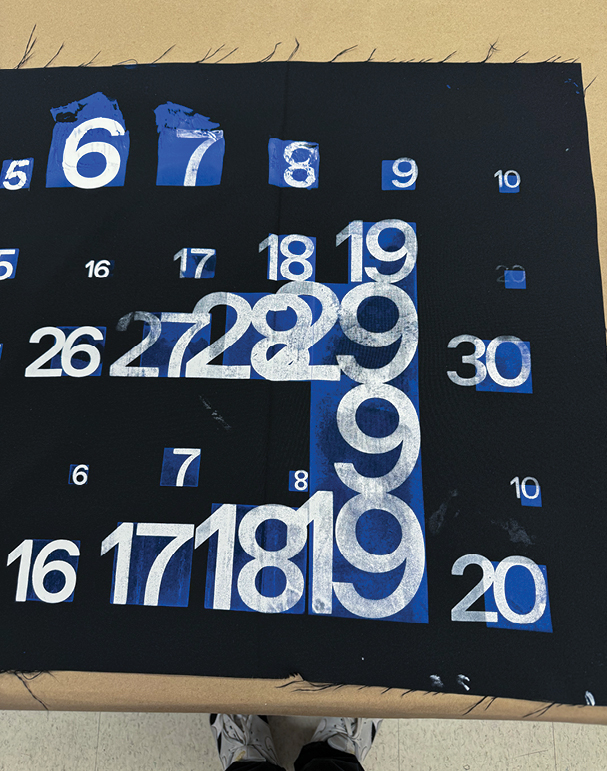
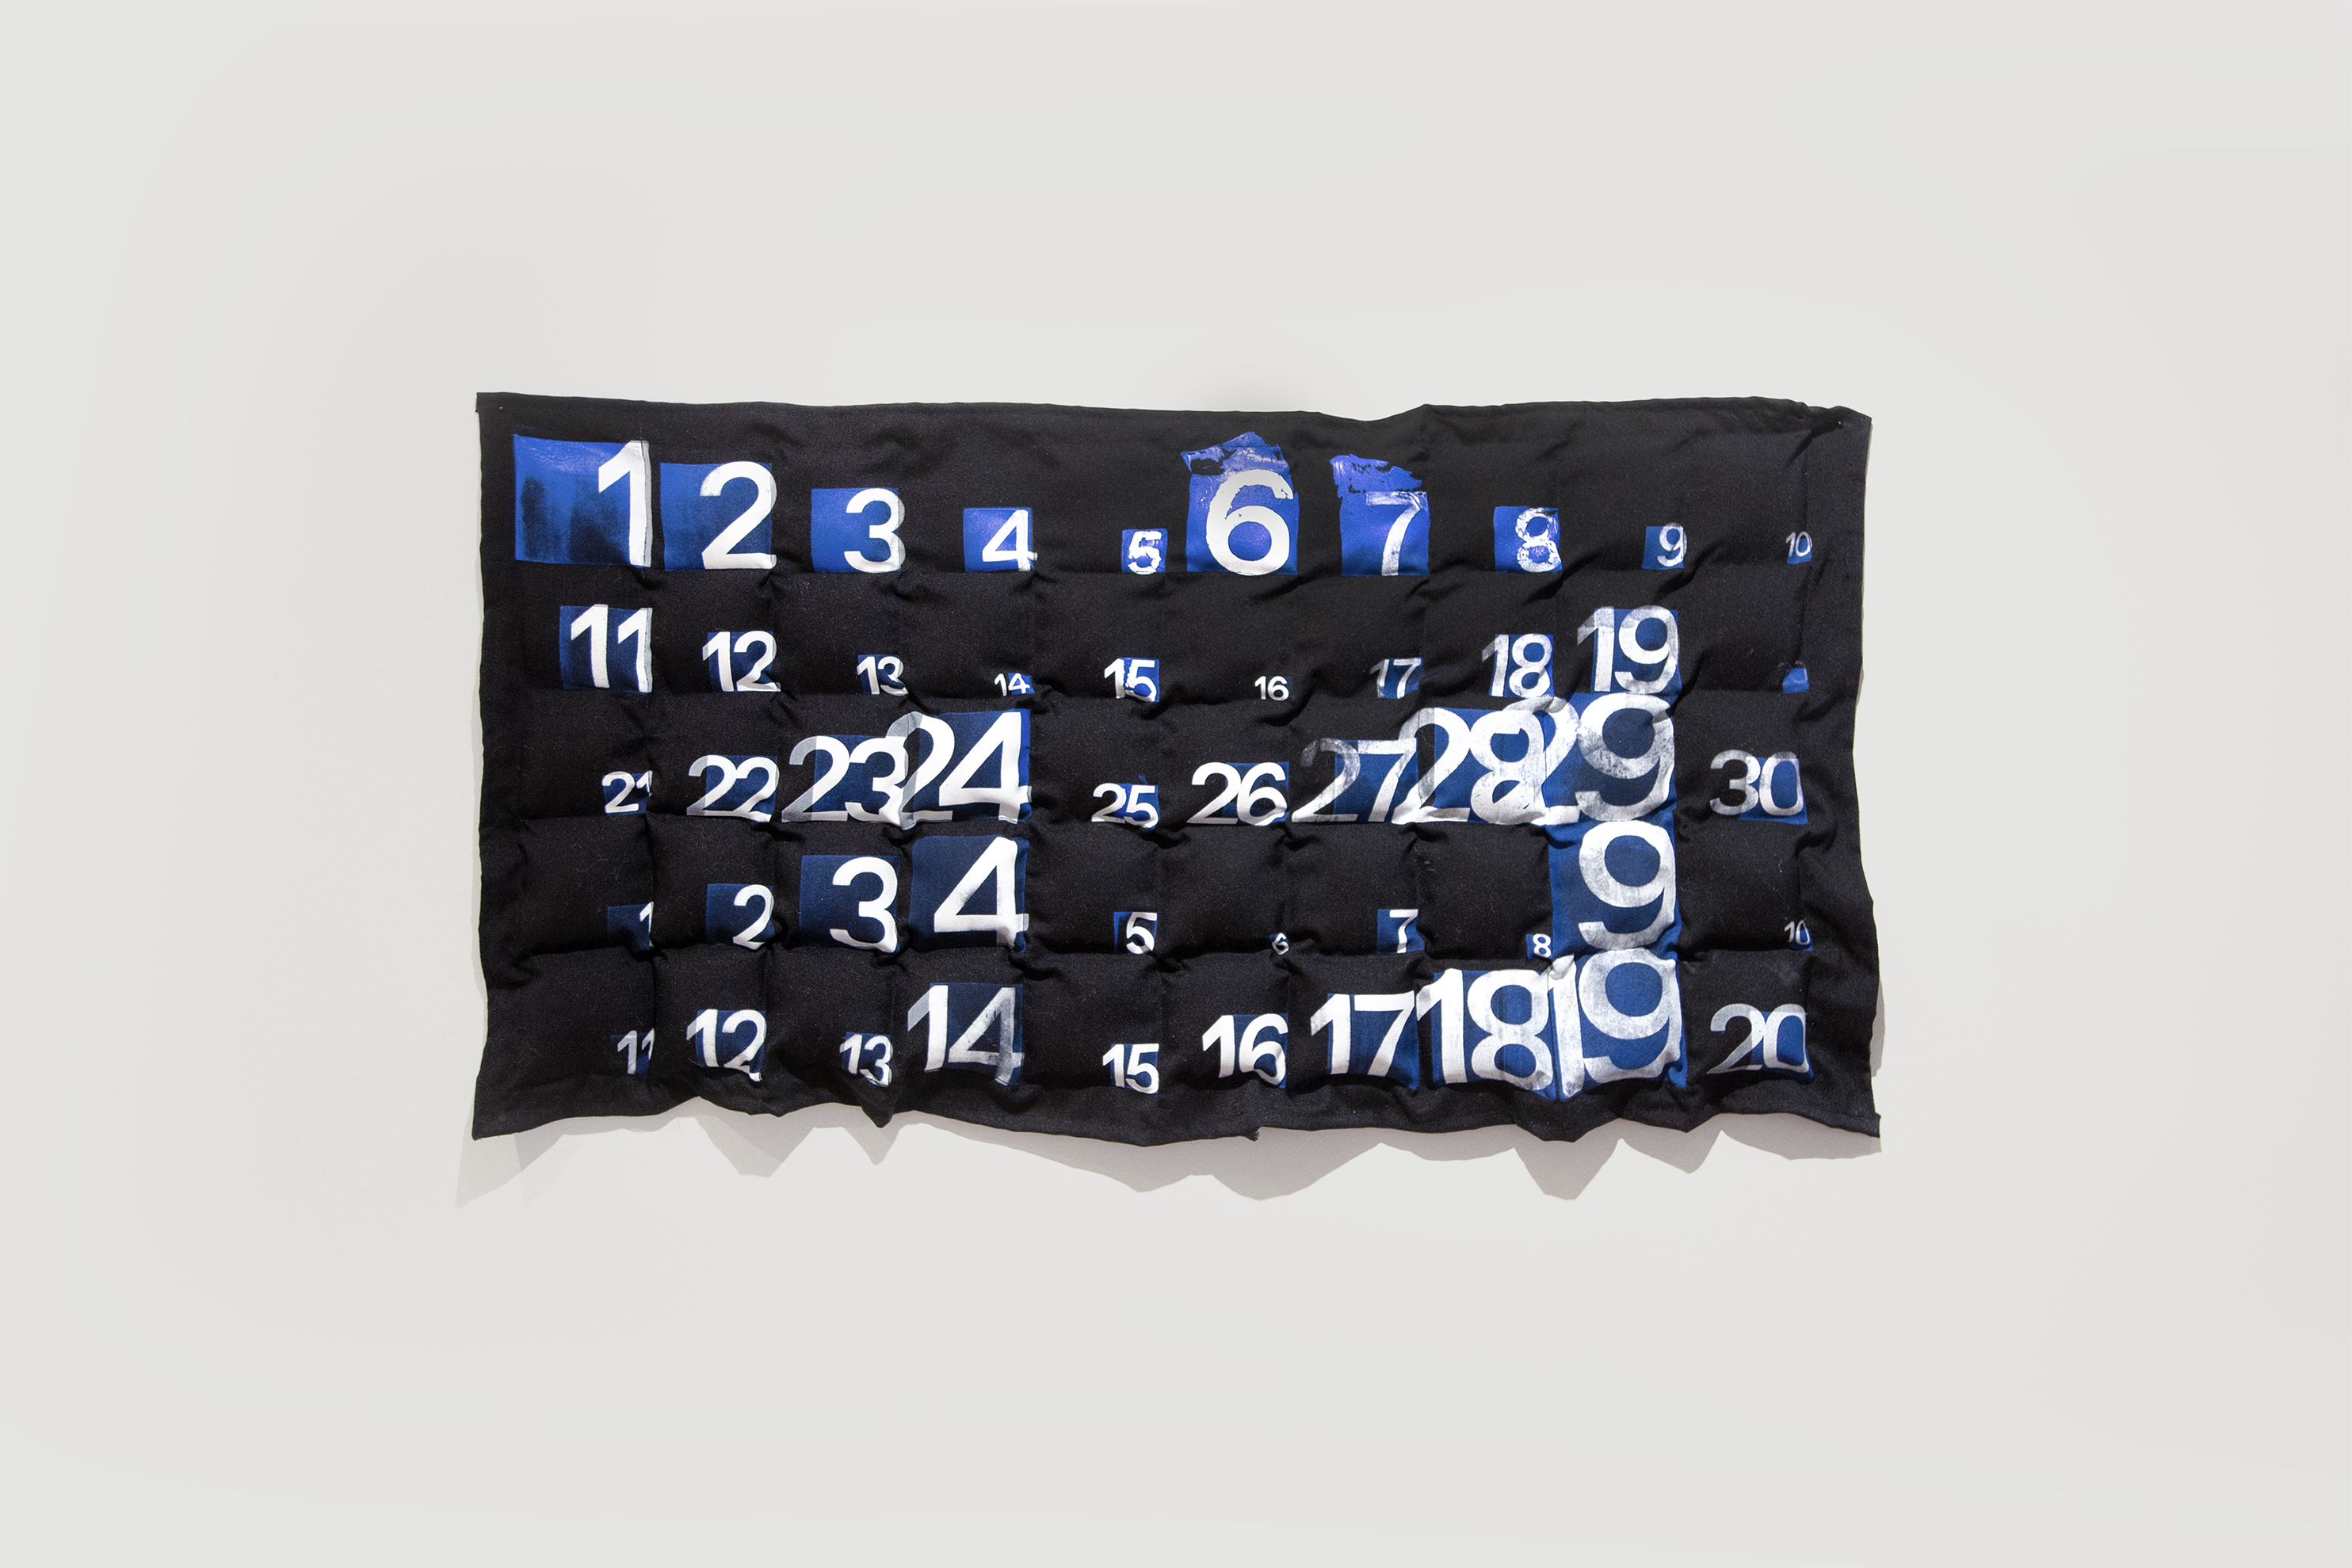
This is the fabric after being screen printed. Each date is positioned inside a square grid, forming both a calendar and an abstract visual structure.
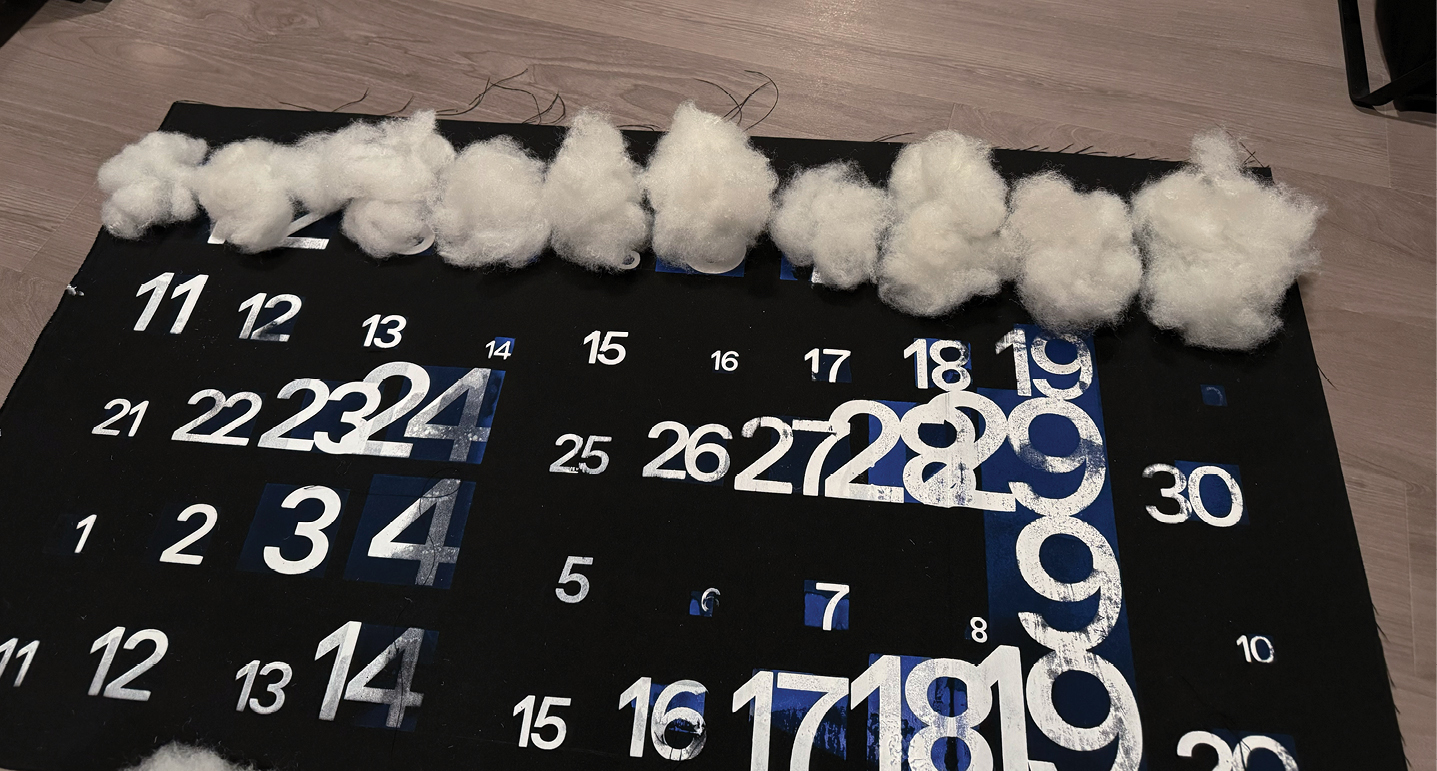
Here, I measured the filling for each day, determining the amount based on the average temperature. Colder days received more filling, while warmer days had less. Each puff becomes like a small climate archive, a container for the memory of that day. I loved this part of the process. It turned numbers into something tangible.
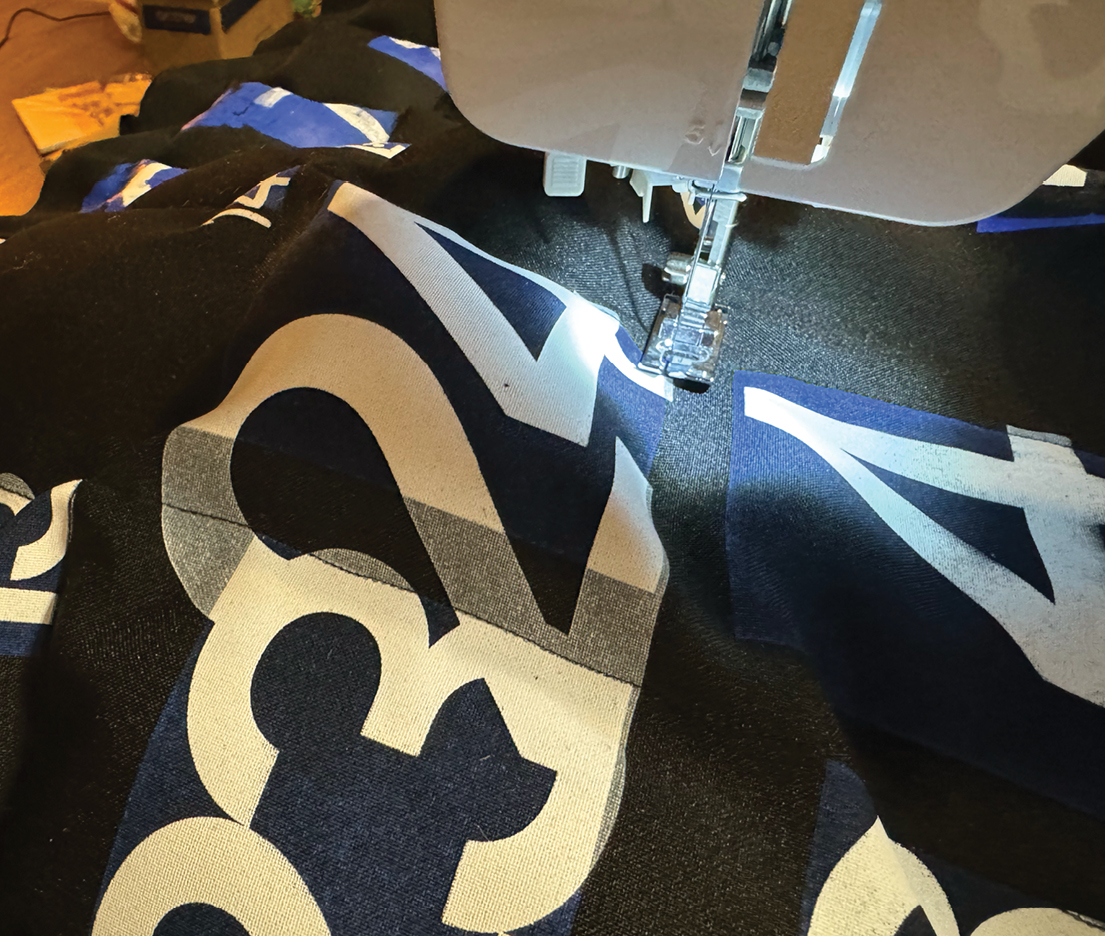
I used a sewing machine to stitch the outlines of each puff one by one. As the fabric began to gather and rise, it reminded of my jacket.
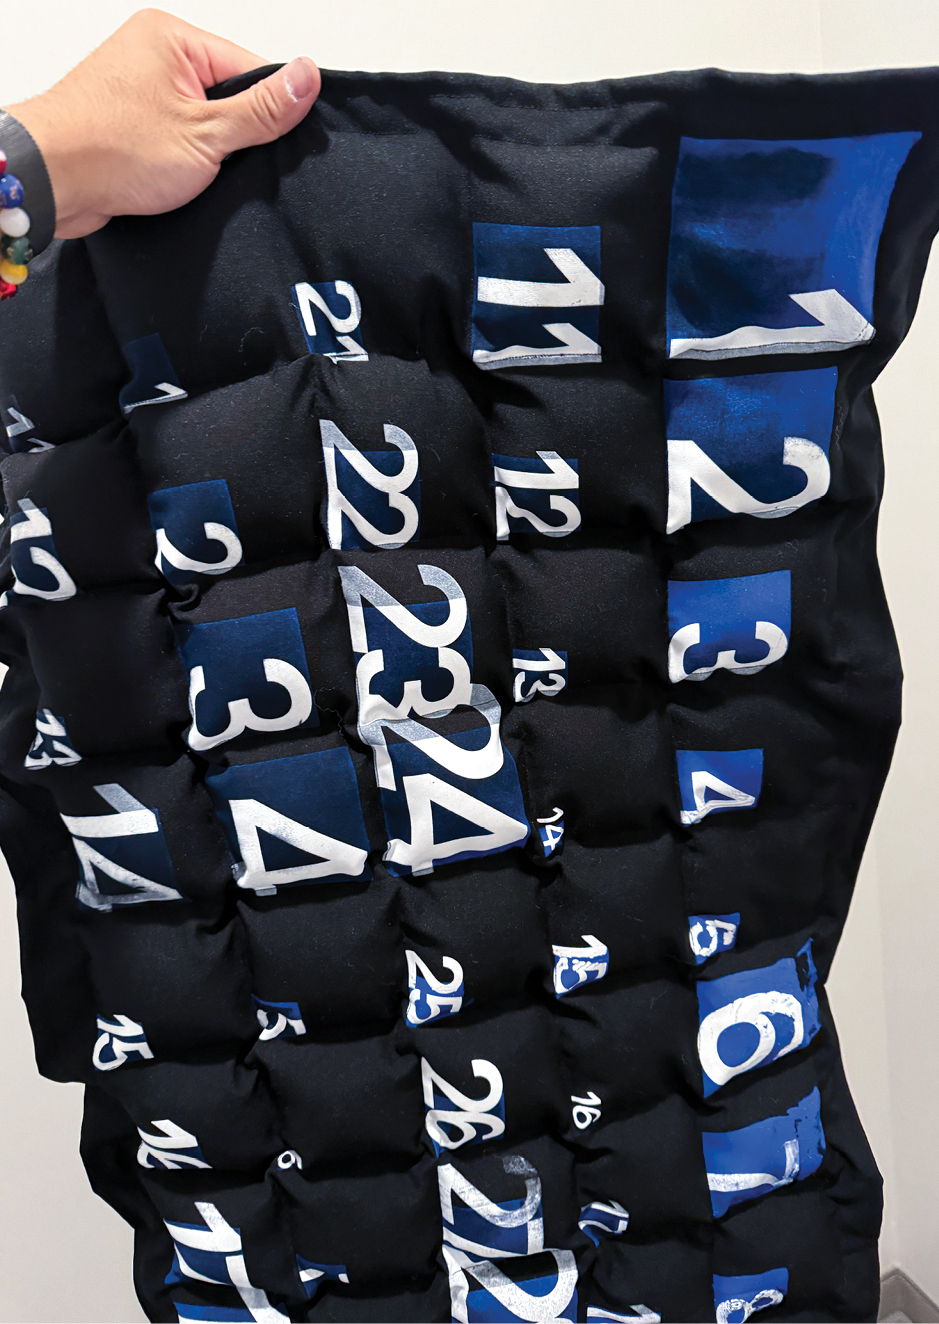
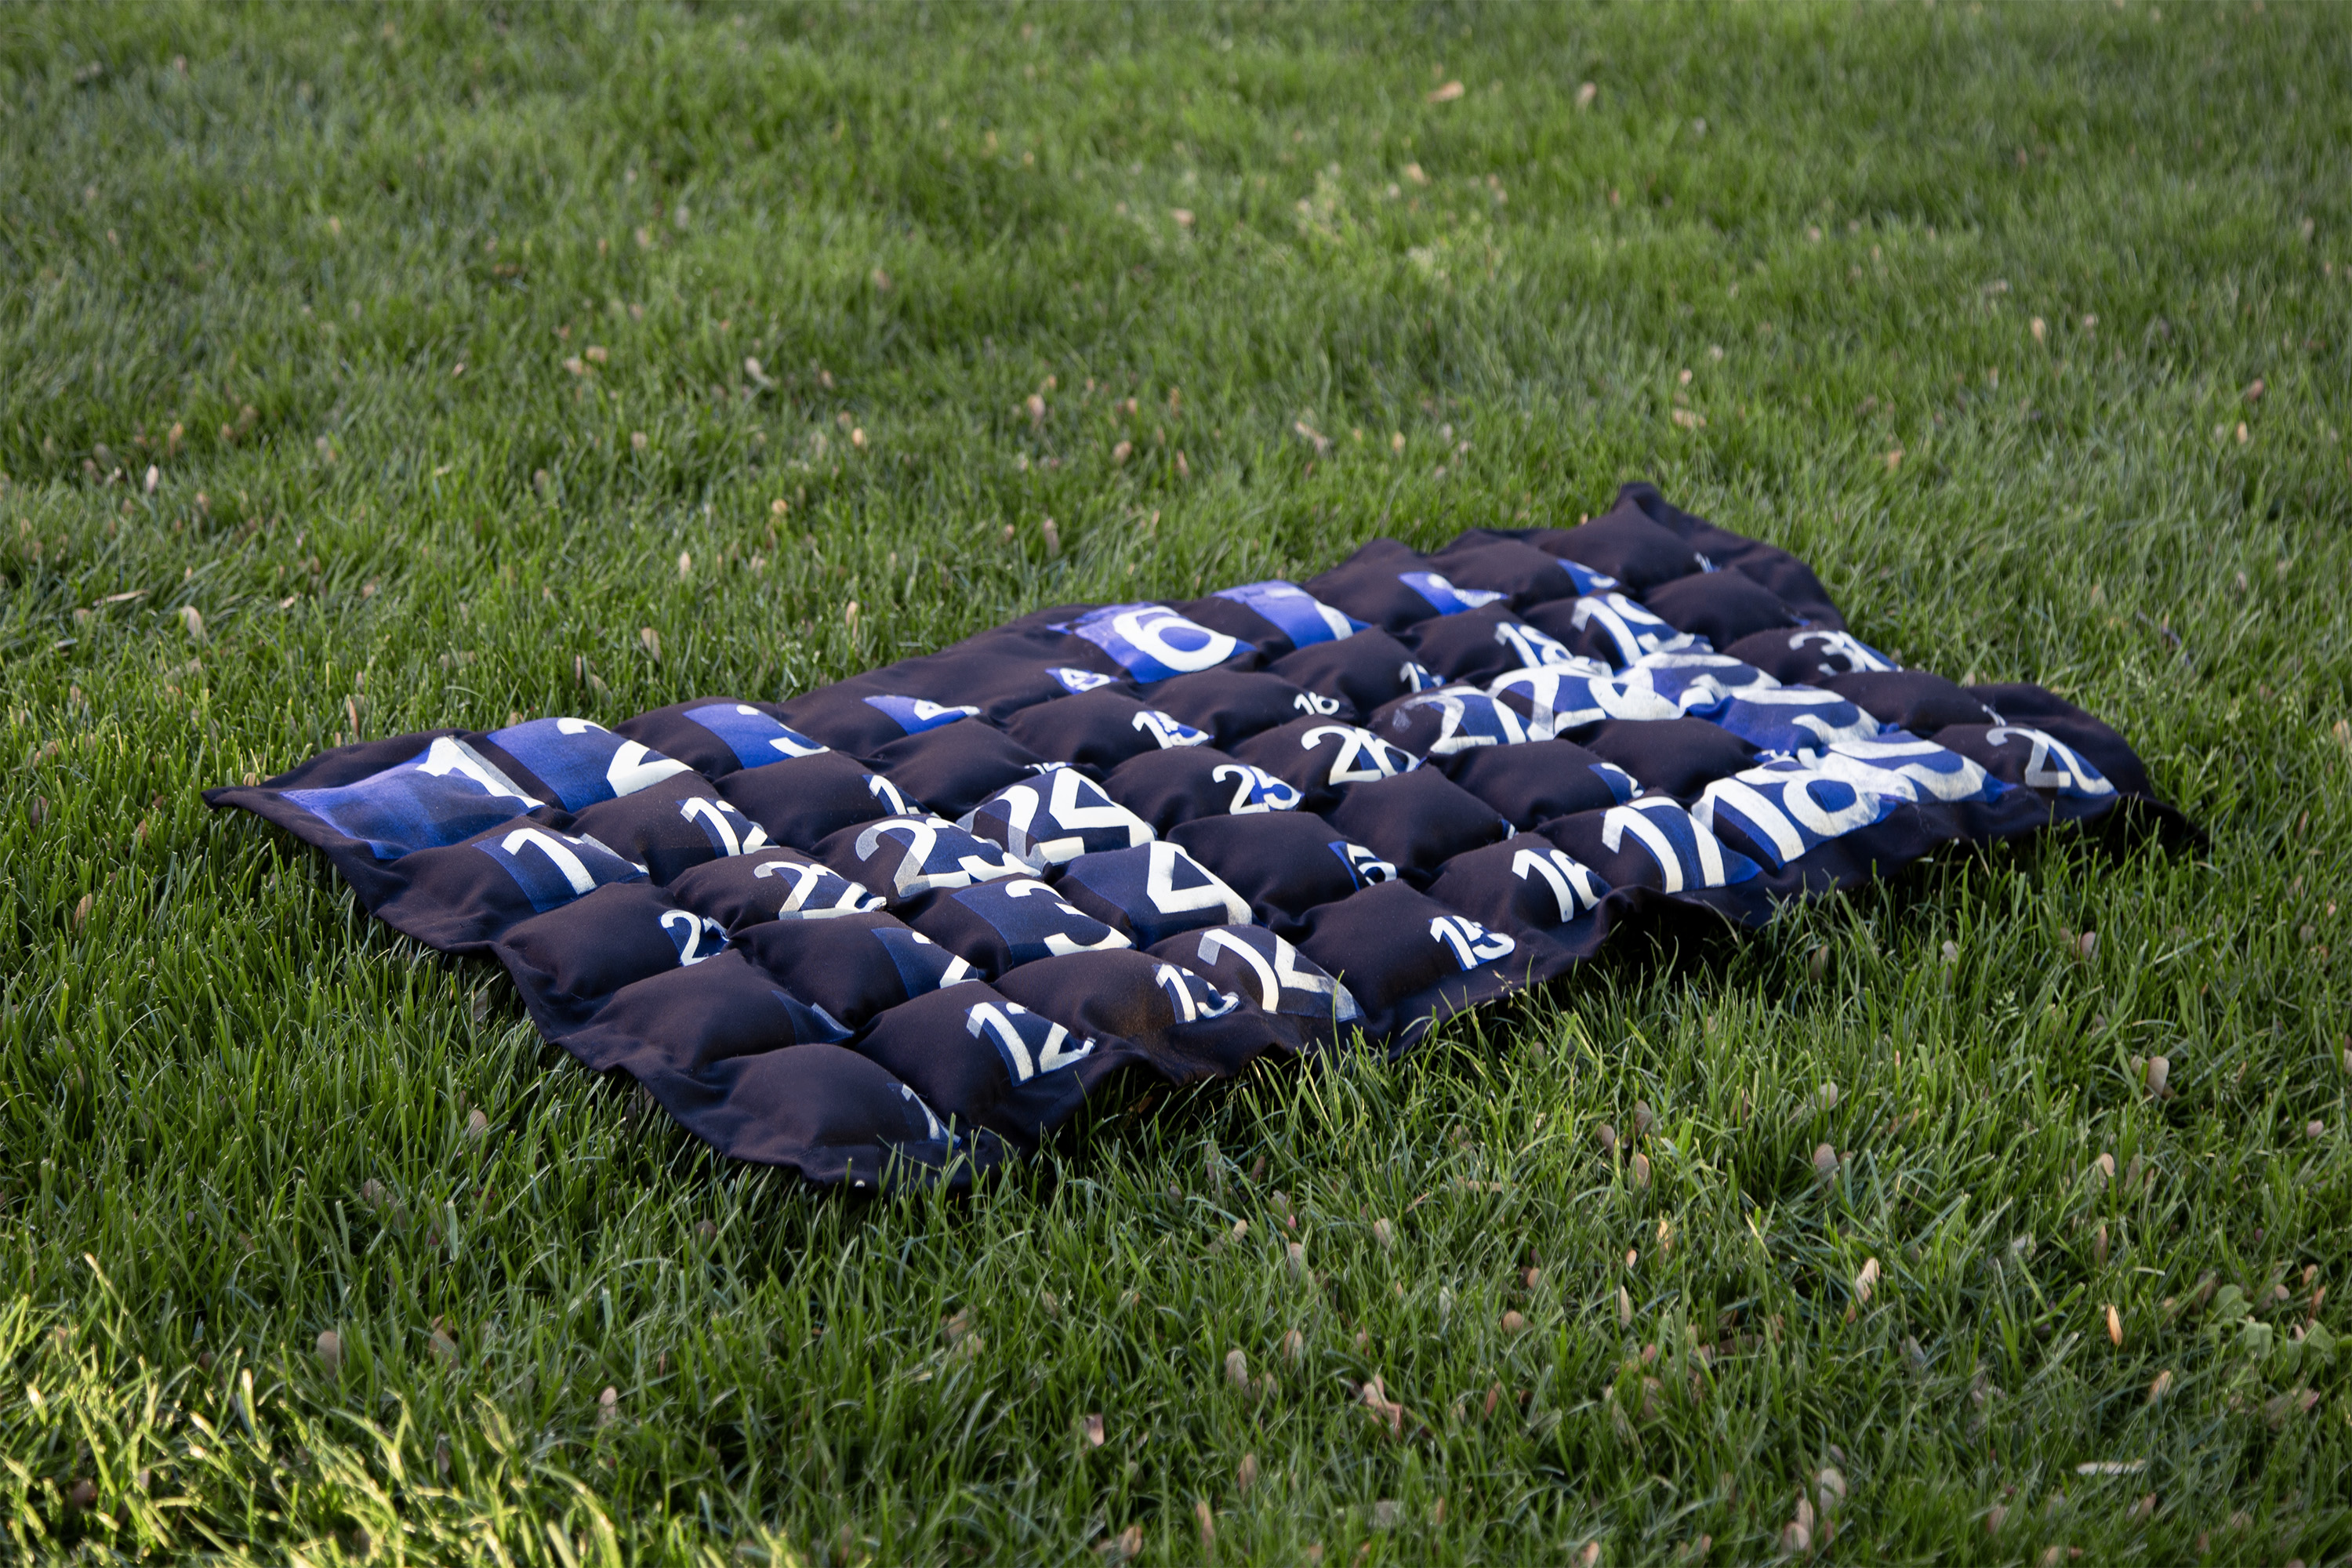
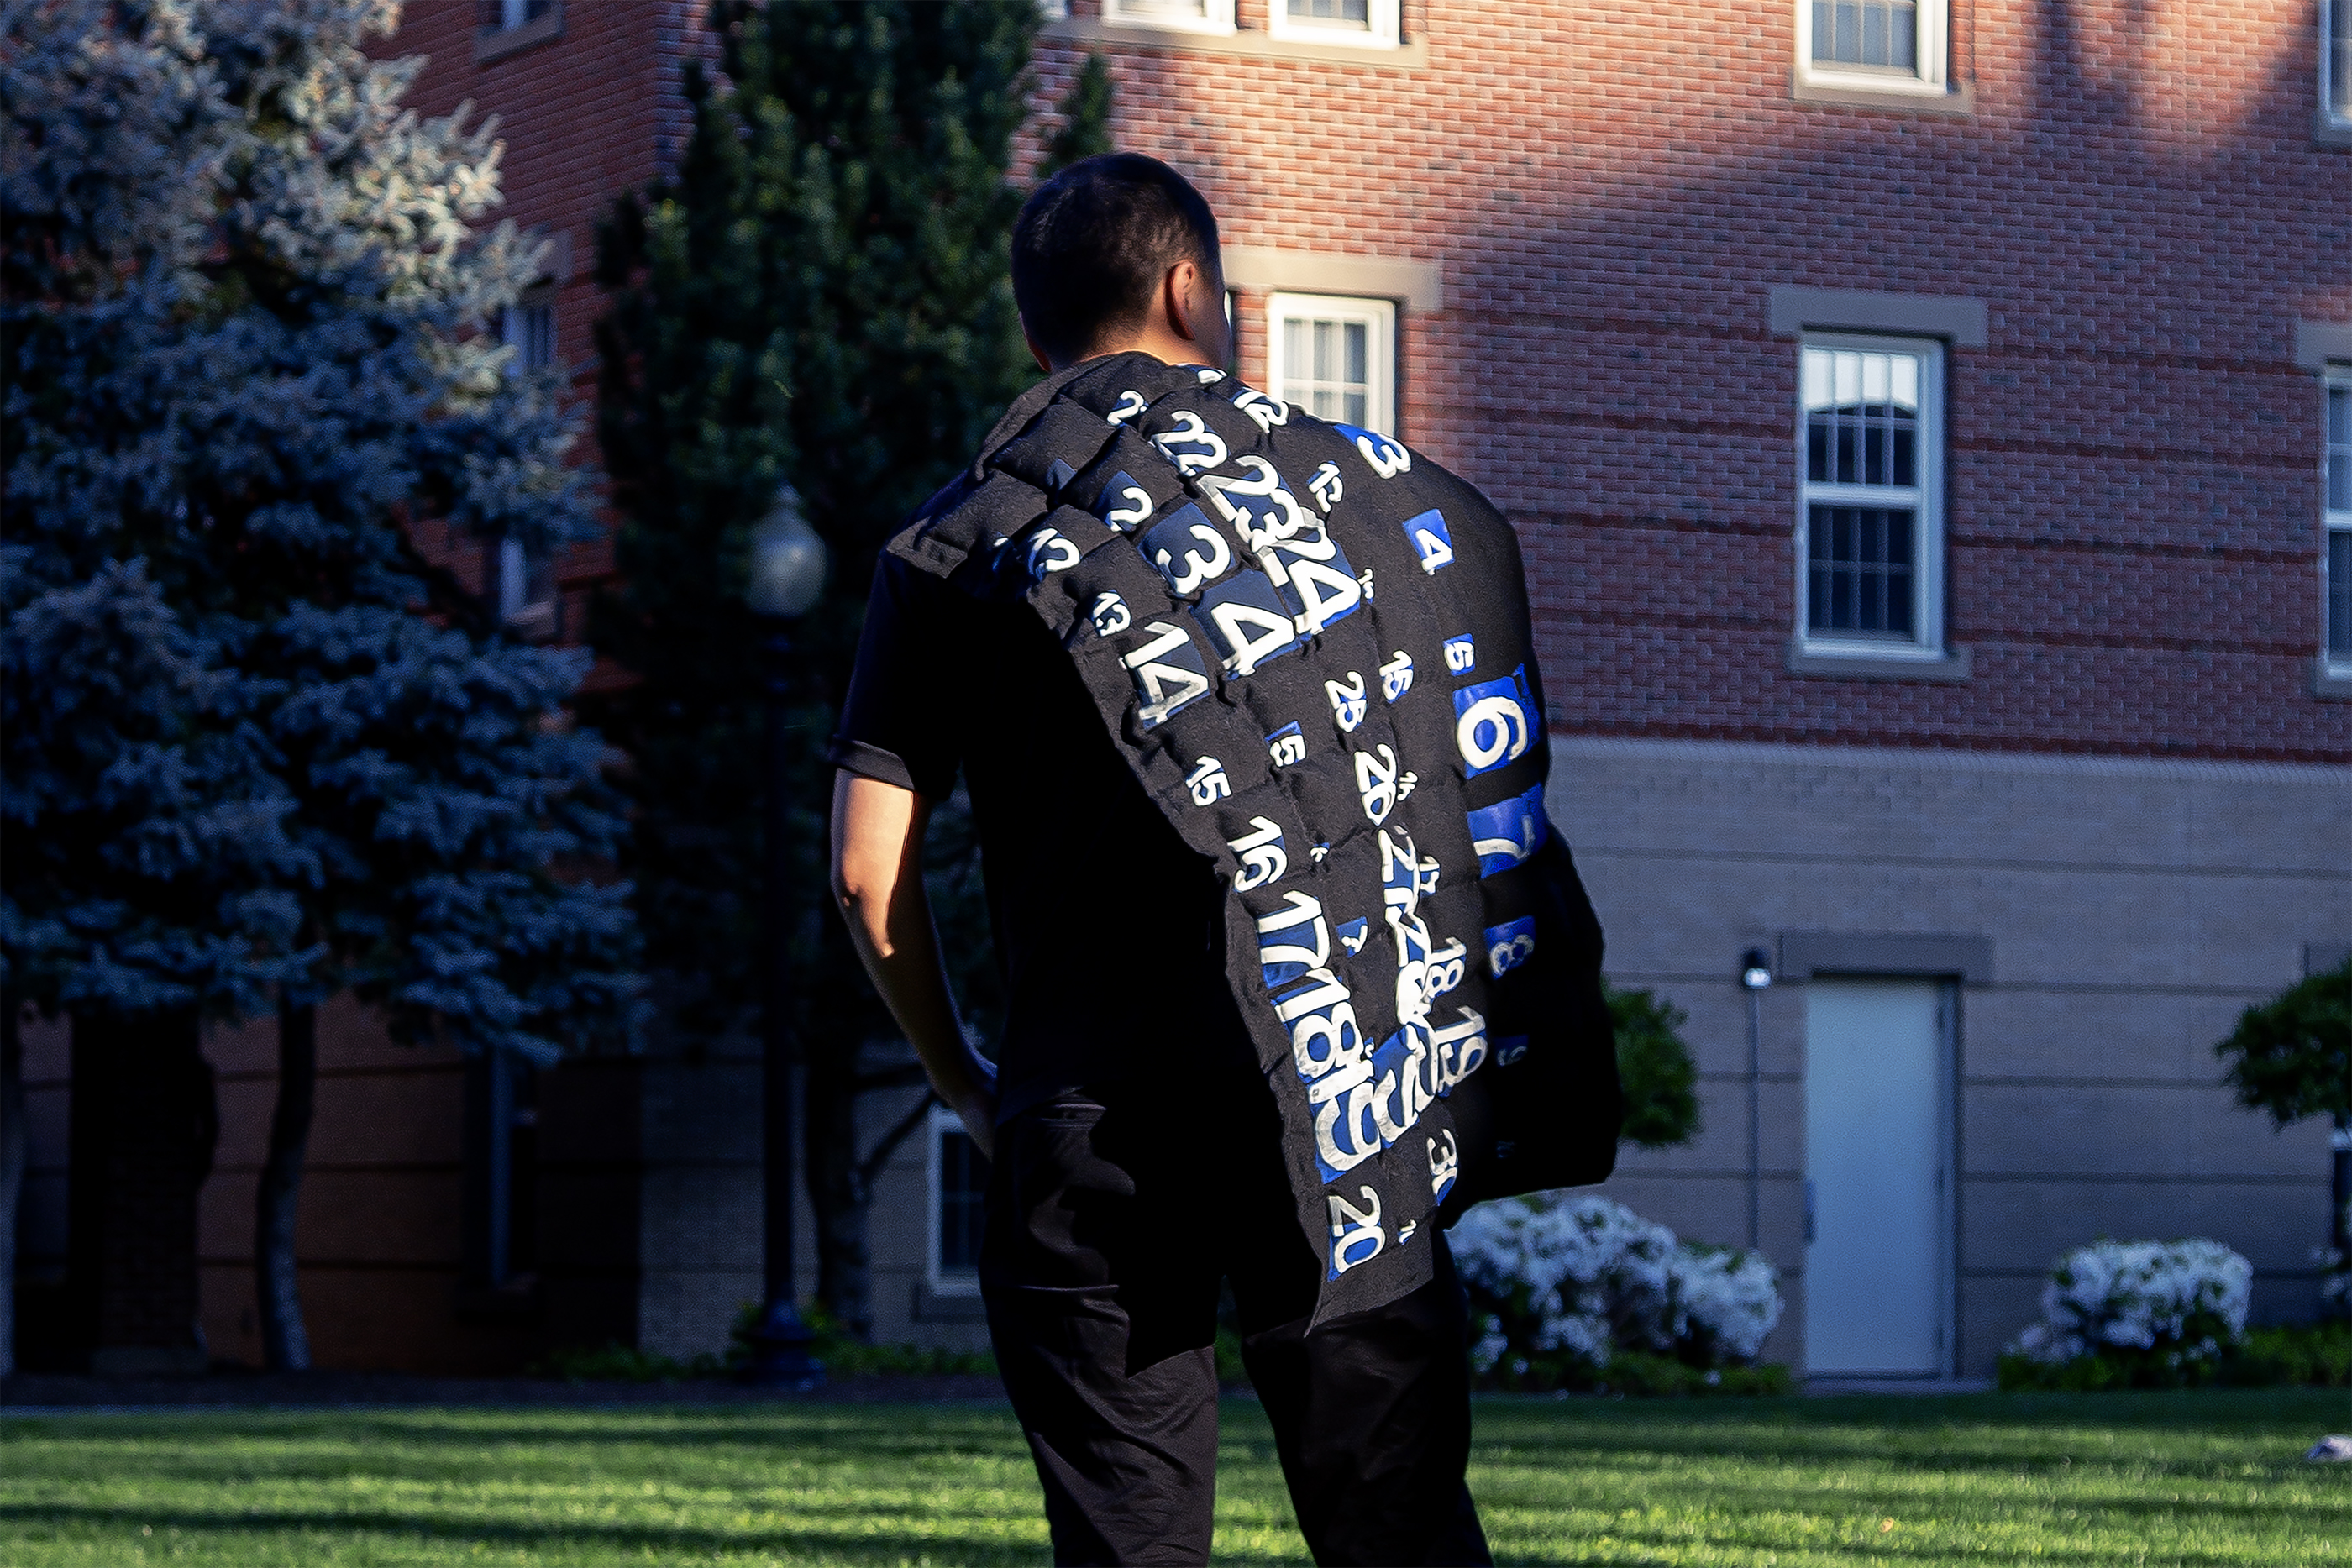
The finished calendar, with all the puffs filled and edges sewn. When held, pressed, or explored by hand, each day reveals a different thickness. The act of touching becomes a way of reconstructing memory, shaped by each person’s own experiences.
Each puff, stitched and filled, holds a day’s temperature inside its form. There are no printed labels, no numerical cues. The materiality carries the information in a different language: one of touch, weight, softness, density. By interacting with each section, viewers are invited to map their own associations: “This is thick. Must have been freezing that day.” Or, “This one’s light. I can almost imagine the sunshine.” Instead of telling you what the weather was, the calendar asks you to imagine it. To fill in the blanks not with data, but with your own memory, experience, and inner imagery. It invites you to become an active participant in reconstructing the season.
Temperature Calendar is a critique of how we quantify experience. Temperature, like many forms of data, is usually presented in numbers: objective, standardized, universal. But numbers, while precise, fail
to capture the personal feelings of a cold day, or the warmth of sun in winter. This want to ask: How to create a multi-sensory experience of data? Instead of providing information to be consumed, it offers a space for active imaginative participation. By transforming temperature data into a tactile, embodied experience, this piece shifts the viewer from passive recipient to active participant. Like many of my works, it blurs the line between receiving and providing, knowing and feeling, data and real experiences.